Styling
Every vector layer has a brush on its row in the tree, and it opens the style dialog. There are two tabs: a Single style for the whole layer, or a Thematic style that colours features by a field. Whatever you set becomes part of the project.
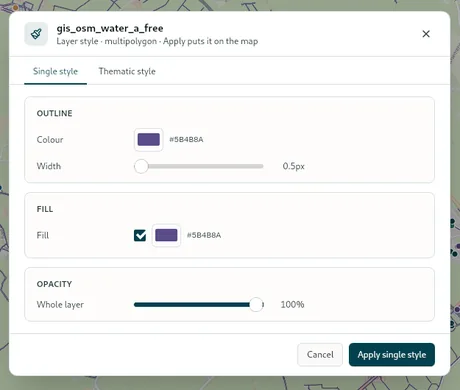
Single style
The controls follow the geometry. A line gets an Outline colour and a Width from half a pixel to eight. A polygon gets an outline Colour and a Fill you can tick off to leave just the outline. Every layer has an Opacity covering the whole of it. Apply single style puts it on the map, and drops any theme the layer was carrying.
Point symbols
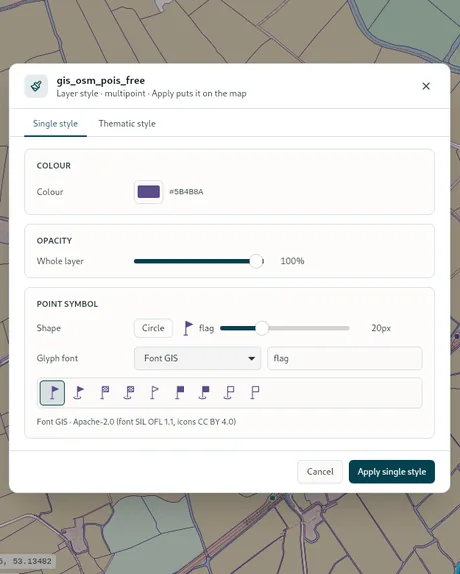
A point layer draws as a Circle with a radius of one to sixteen pixels, or as a glyph from one of five bundled icon fonts: Font GIS, which has the map symbols such as a well, a tree or a survey marker; Material Symbols; Font Awesome in both its solid and regular sets; and Phosphor. Pick the Glyph font, search the glyphs by name, and click one. A size slider from 8 to 48 px then replaces the radius. The font and its licence are named at the bottom of the picker.
Thematic style
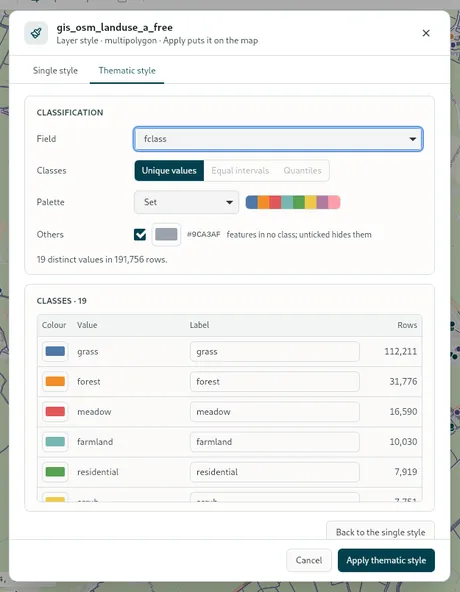
Choose the Field, with the numeric ones marked. Then decide how its values become Classes. Unique values gives every distinct value a class of its own, or the commonest ones when there are a great many. Equal intervals and Quantiles, for numbers, cut the range into somewhere between two and twelve classes, either of equal width or of equal count. The dialog reads the field first and tells you what it found in there.
Pick a Palette: for unique values the categorical ones (Set, Pastel, Tableau 20, Dark, Accent, Paired, Bold, Vivid, Safe for colour-blind readers, Okabe-Ito); for ranges the sequential and diverging ones (Blues, Greens, Reds, Yellow to red, Viridis, Spectral, Magma, Turbo, Red to green, Brown to teal and the rest). Every class in the table below can then be changed by hand: its colour, its label, and for a point layer its own glyph. Others is the colour of features that fall in no class; untick it to hide them.
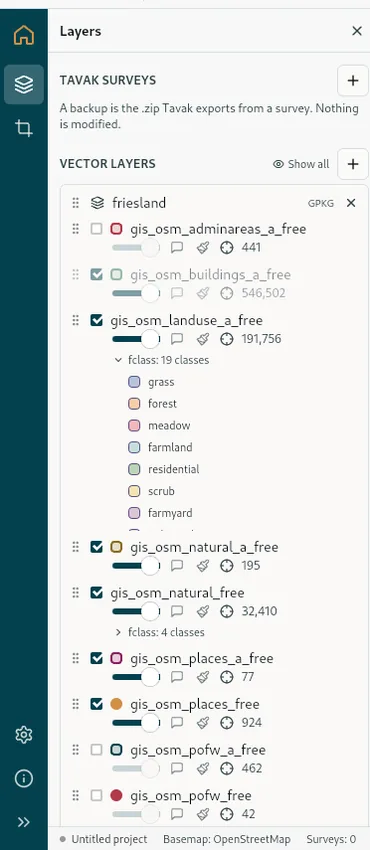
Apply thematic style puts the theme on the map, and the layer's row in the tree grows a legend: a fold button named after the field and the number of classes, then one swatch for each class. Back to the single style returns you to the other tab, and applying that drops the theme.
The theme and the single style are kept apart. The single style's outline width and opacity still apply underneath a theme, and switching between the tabs loses nothing until you actually press Apply on the other one.