Vector layers
Anything OGR reads goes on the map: a Shapefile or a zip of twenty, GeoJSON, KML and KMZ, GPX, a CSV or a spreadsheet with coordinates, GeoPackage, a File Geodatabase folder, MapInfo, GML, FlatGeobuf, DXF, OpenStreetMap extracts and plenty more. The formats page has the full list. Millions of features pan smoothly, because the file is indexed once and then cut into tiles as you look at it. Your file itself is never written to.
Adding a file
Add › Vector file…, or Vector on the toolbar, or the + on the tree's Vector layers heading, opens a picker that groups the formats into GIS vectors, tables with coordinates, tiles and CAD, other vectors, and any file. Several files at once is fine. A File Geodatabase is a folder rather than a file, so it has its own entry: Add › File Geodatabase…. A zipped Shapefile, a .gpkg.zip or a KMZ opens as it stands, with no unpacking.
You can follow what happens next in the tree. First Reading the file…, then, the first time only, Preparing the spatial index, once per file…, while the file is copied into a GeoPackage in Homestead's cache with a spatial index. A GeoPackage that already has one is read where it lies. Then Opening the layers…. Every layer of a multi-layer file becomes a row of its own. Tiles are cut from that index on demand, simplified for the zoom you are at, and kept on disk once seen, so no area is ever cut twice, in this session or any other.
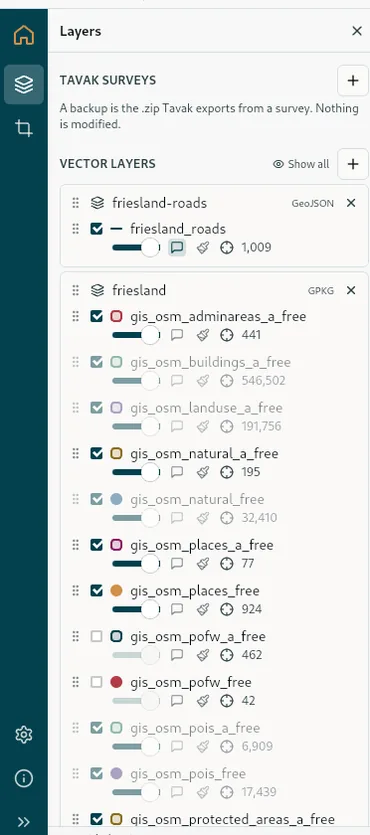
The rows in the tree
A file row shows the file's name, with its full path in the tooltip, the driver that read it, and an X that removes it along with all its layers. Any warnings about the file print underneath. Then, under the file, one row per layer, two lines each:
- First line: the grip you drag to move the row, since the order in the tree is the drawing order with the top one on top; the visibility tick; a glyph in the layer's colour; the layer's name; and a small badge naming the coordinate system when it is not the map's.
- Second line: the opacity slider; the hover tip bubble, which when it is on makes a tip follow the cursor over the layer's features; the brush that opens the style dialog; the crosshair that zooms to the layer; and the feature count.
The heading's Show all and Hide all tick every layer in the section at once. Tables drag among the tables of their own file, and files drag among files.
A layer that is dimmed
A dense layer is held back below the zoom where its tiles would be too heavy to draw. Its row goes dim and the tooltip reads Zoom in to N to see this layer. Zoom in and there it is. A table with no geometry, or one whose coordinates could not be placed on the globe, is listed after the mapped ones and stays dim for good, with the reason in its tooltip.
Files without a coordinate system
A CSV, a TopoJSON, a DXF, a DGN or a GeoRSS says nothing at all about its coordinate system. If every coordinate in the file fits inside longitude and latitude, the layer is taken as WGS 84 and a warning under the file says as much. If not, it is kept as a table and stays off the map. A Shapefile with no .prj is treated the same way.
Tables with coordinates
A CSV, TSV, Excel or OpenDocument file becomes a point layer when it has a pair of columns named X/Y, lon/lat, longitude/latitude, easting/northing or bujur/lintang (any case), or one column named WKT, geom, geometry, the_geom or shape holding well-known text. Any other sheet or table is listed but not drawn.
From the internet
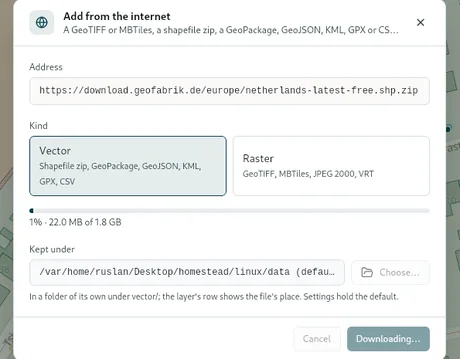
Add › From the internet… fetches a dataset by its address and puts it on the map: a Geofabrik extract, a GeoPackage on a server, a GeoTIFF, an MBTiles. Paste in the Address, check the Kind, which is guessed from the address until you pick one yourself, and press Download and add. The file is kept in a folder of its own under vector/ or raster/ in the Homestead data folder. Kept under shows you where that is, Choose… changes it for this one download, and Settings holds the default. The layer row's tooltip is the file's location, so you can always find it again.